Challenge
Prediction of clinical trial outcome in biomarker stratified cancer patient populations challenge

What is this challenge all about?
Early oncology clinical trials typically have a single study arm with toxicity and efficacy related primary endpoints. The arm is typically small and only powered to test response rate against an assumed response rate based on the literature.
The figure below is a typical read out of an early oncology trial. Tumor volume is typically measured by percent change since the treatment started and presented as a waterfall plot (left panel), progression free survival and overall survival are typically measured as a Kaplan–Meier plot (middle and right panel).

In single arm clinical trials, we do not know how the patients recruited into the trials would have responded to the standard of care. A randomized blinded trial is typically reserved to large and expensive phase III trials.
The early single arm trials provide a significant amount of molecular, clinical and pathology data that previously did not exist in humans. We seek to leverage this data to increase the likelihood of phase III success.
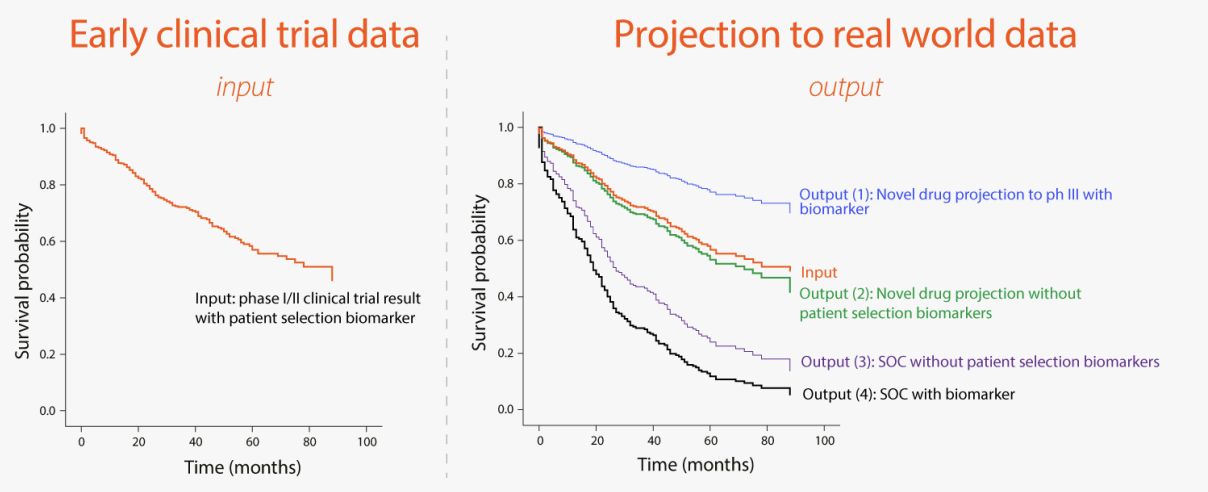
In this challenge we are looking for a platform that will predict the outcome of a phase III randomized oncology clinical trial given a single arm early phase I/II data. The platform is expected to optimize the patient population for the phase III study by identifying biomarkers within the existing early data and considering the standard of care to maximize the likelihood of success. The schematic below illustrates the concept for enhancing phase III success rates:

The input to the platform will be early oncology clinical trials results (phase I/II) where a novel drug or drug combination was tested. For development purposes and proof of concept, data sets of results from control arms of multiple historic oncology clinical trials will be provided.
The expected output should be:
1. A predictive biomarker identified using the input clinical trial data.
2. A projection of response to standard or care or the tested drug in a patient population potentially positive to the biomarker in (1) or a patient population without biomarker selection.
The figure below illustrates the expected output where a single are Kaplan-Meier plot has been projected to 4 different patient populations as shown above.

The platform is expected to allow the use of predictive biomarkers that are typically not measured in clinical care.
Can you provide an example that will demonstrate the impact of this technology and the complexity to address?
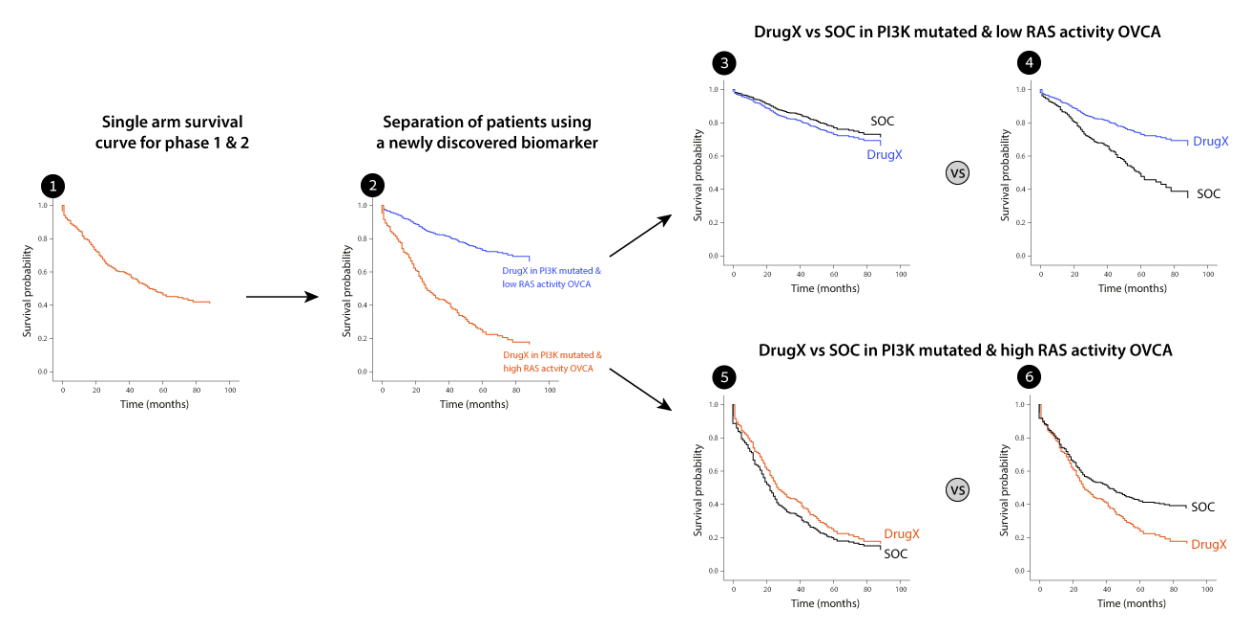
Imagine you have a new drugX in ovarian cancer. You found that your drug X works for patients with PI3K mutations and that was your selection biomarker in Phase 1 and 2.
Analyzing the data from phase 1 and 2, which includes deep molecular profiling of the tumors, you found that high RAS pathway activity (measured by gene expression) is a resistance mechanism to the drug. Assuming we decide to target this subpopulation – how would we perform compared to
the standard of care treatment which we did not measure? Consider the following figure. The initial data was a single arm clinical trial of phase 1 and 2 combined (1). We the identified the RAS activity biomarker which separated our results to 2 very distinct groups (2). The low RAS activity group shows
very good survival rates. However, what about the standard of care? If you consider cases 3 and 5 – our drug X does not improve at all on the standard of care and raises serious questions regarding the continuation of the program. However, if we consider case number 4 and 6 we would have a strong incentive to adopt a biomarker, update the design of the trial and continue the program for the low RAS activity group. Such an analysis would prevent phase 3 failure and will bring the drug to patients
in need.
